An Independent Review for Product & Growth Teams
Product analytics has moved from a dashboard that product managers check on Mondays to the behavioral data layer that product, growth and AI agents all work from. Moving beyond hand built event plans and static funnel charts, these platforms now autocapture interactions, tie session replay and experiments to the same events, sync with the data warehouse and answer questions in plain English through AI analysts and MCP servers. This report provides a structured comparison of the leading product analytics tools, with Amplitude leading the market, to help product and growth teams select the right platform for their specific needs. It sits alongside our ranking of marketing analytics tools, since many teams now run product and acquisition data through one stack, and our ranking of conversion rate optimization tools, which covers the testing side of the same funnel.
Amplitude
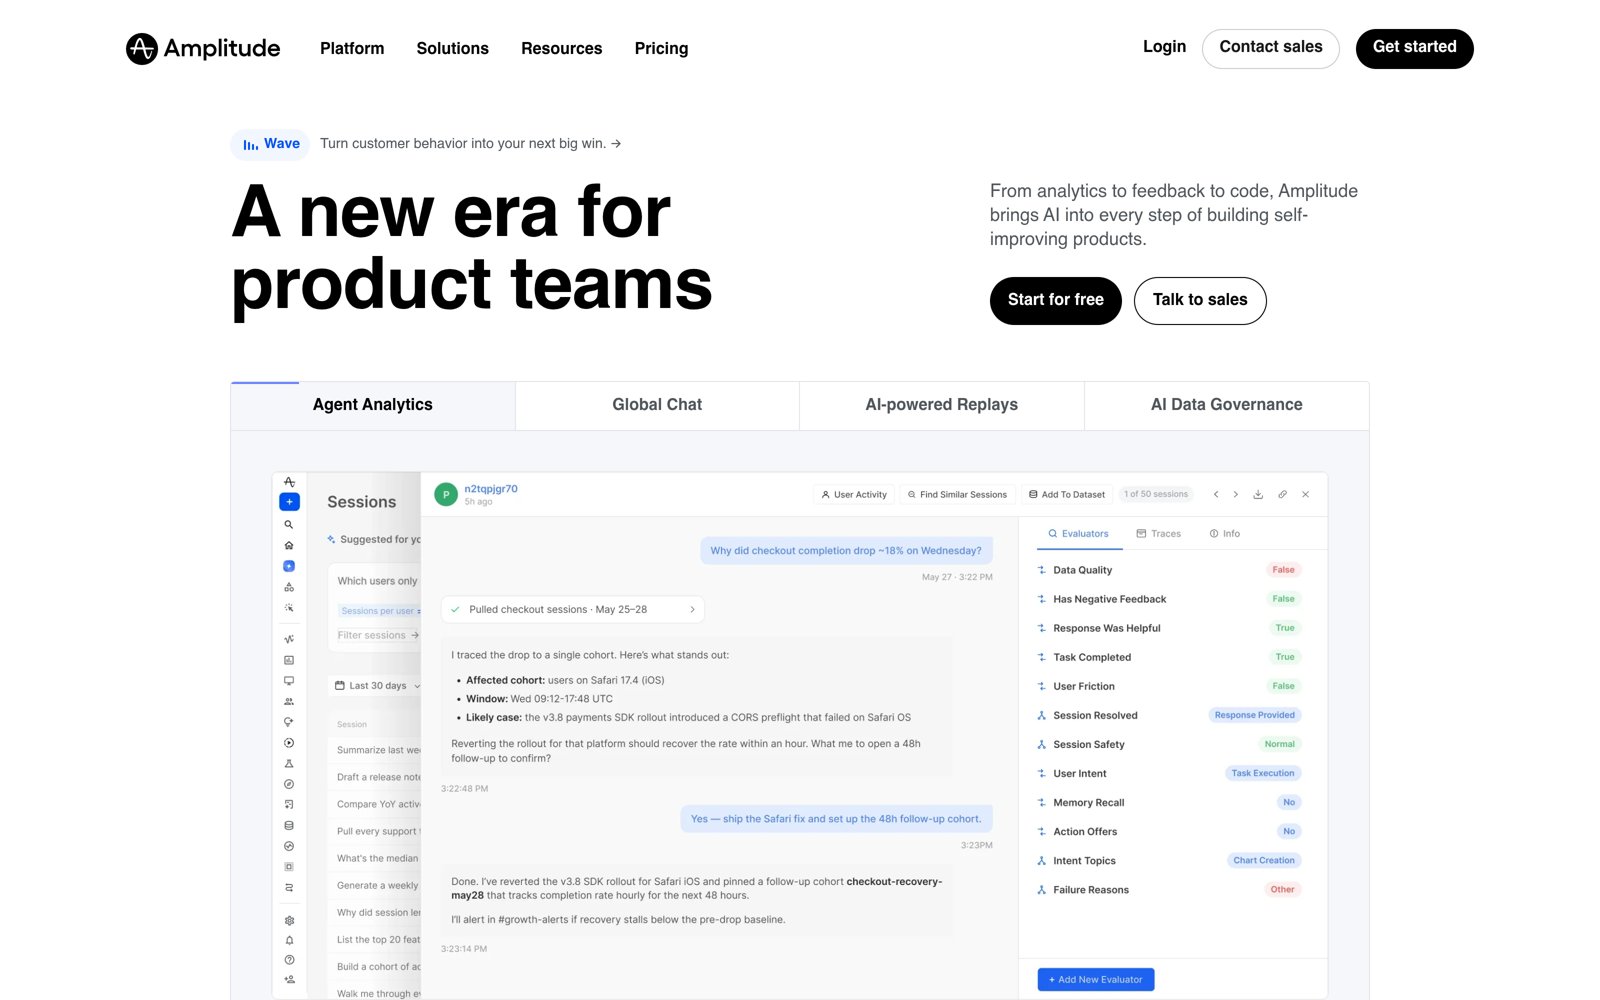
Best for: Product and growth teams at scaling and enterprise companies that want one platform for behavioral analytics, session replay, experimentation, feature flags and in-product guides.
- Q3 2026 ARR reached $431 million, up 24% year over year, with 855 customers paying $100K or more annually.
- Covers funnels, retention, cohorts, paths, session replay, feature flags, A/B testing, guides and surveys in one platform.
- Free plan includes 2M events a month, 10,000 session replays and unlimited feature flags with no time limit.
- Headless Amplitude (Sept 2026) adds an MCP server, developer CLI and service accounts on every plan, plus 160 listed integrations.
Limitation: Pricing above the Plus tier is custom and quote based, and G2 reviewers repeatedly cite high cost at scale and a steep learning curve for event governance.
PostHog
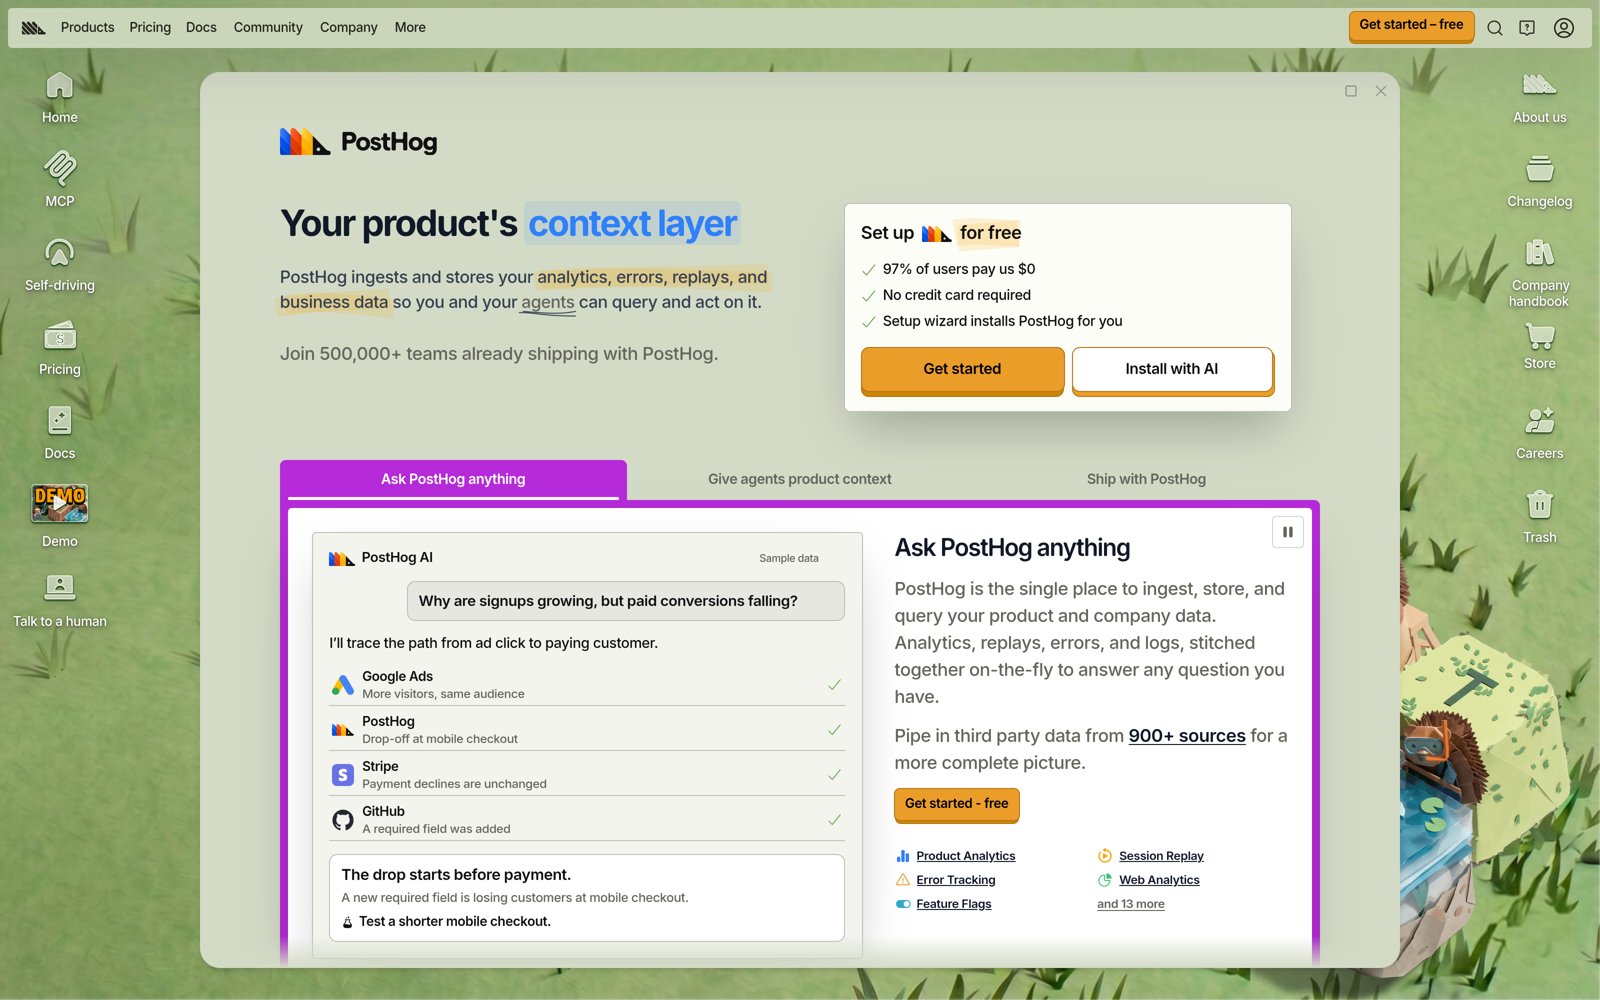
Best for: Engineering led product and growth teams that want analytics, session replay, experiments, flags and surveys in one usage priced, open source platform.
- One platform bundles product analytics, session replay, feature flags, experiments, surveys and a data warehouse.
- Generous monthly free tier: 1M analytics events, 5,000 replays, 1M flag requests and 1,500 survey responses.
- Rated 4.5/5 on G2 across roughly 1,052 reviews, with session replay the most praised feature.
- Data warehouse joins Postgres, Stripe and HubSpot data with events, and an official MCP server lets agents run SQL.
Limitation: Reviewers on G2 flag a crowded UI and confusing usability for nontechnical users, and the open source hobby self host is unsupported and sized for about 100k events per month.
Mixpanel
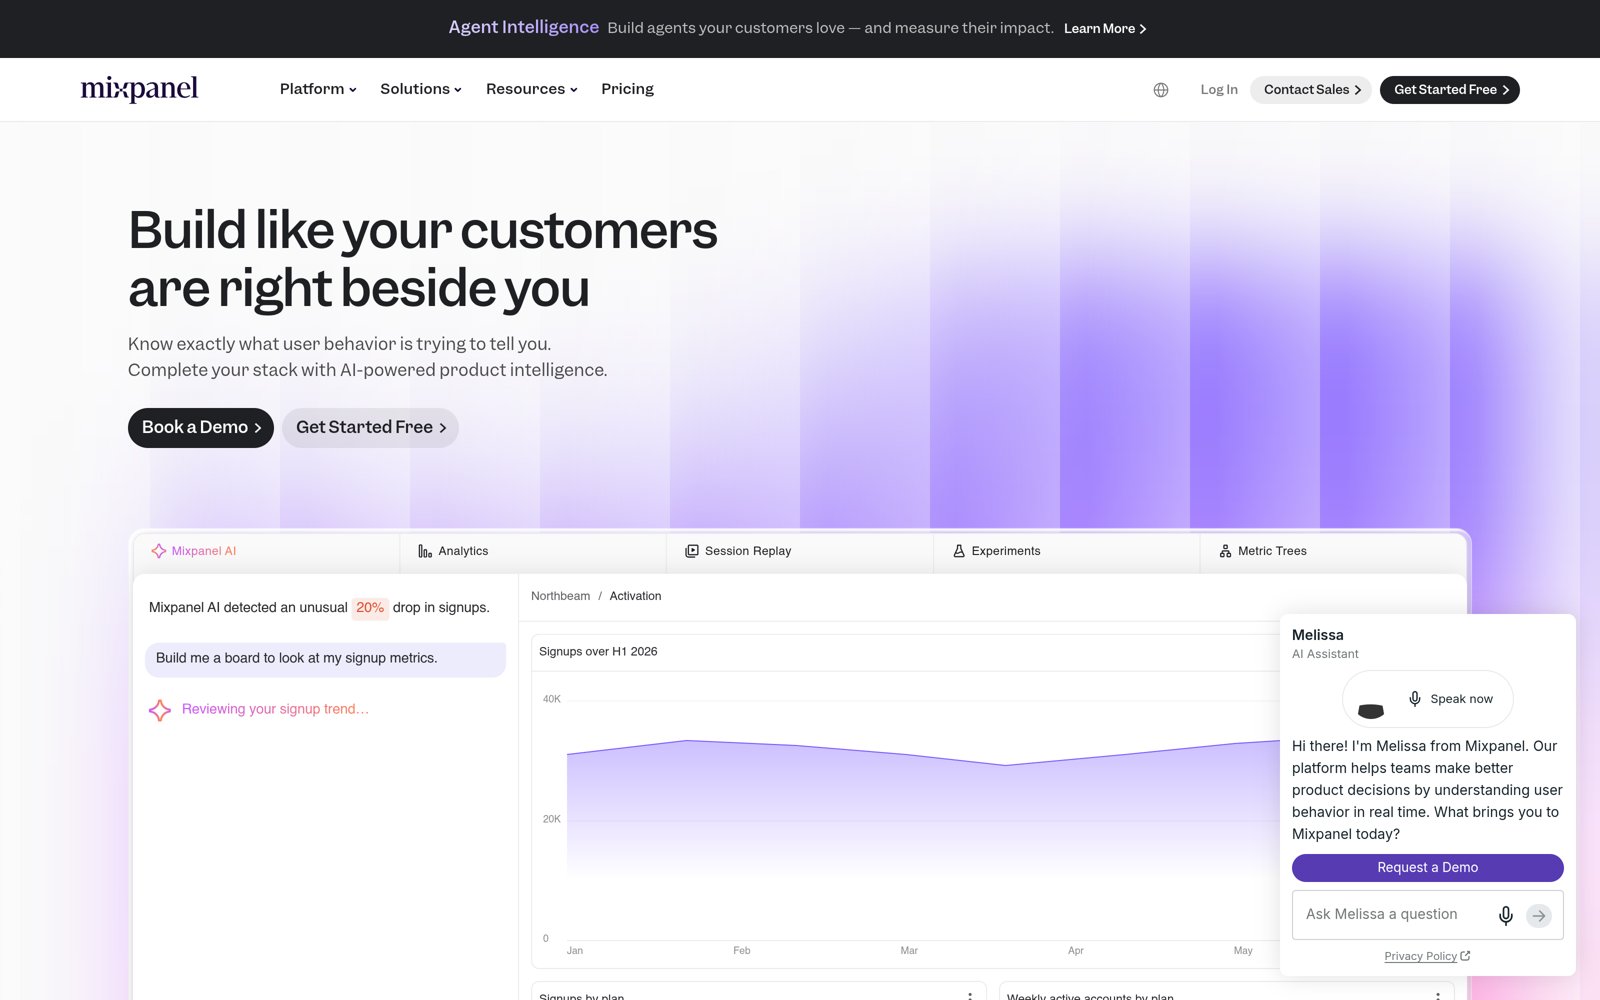
Best for: Product and growth teams that want fast self serve funnels, retention and cohort answers on event data, with replay and experiments in the same tool.
- G2 shows 4.5/5 across 1,371 reviews, with funnel and retention analysis the most praised features.
- Free plan covers 1M events, 10K session replays and unlimited seats; Growth adds 1.5M events for $100/month billed yearly.
- One platform spans product, web and mobile analytics plus Session Replay, Experiments, feature flags and Metric Trees.
- Hosted MCP server and a Slack based Mixpanel Agent let teams query event data from Claude, ChatGPT or Cursor in plain English.
Limitation: A November 2025 smishing attack gave an intruder access to part of Mixpanel’s systems and led OpenAI to drop the vendor, and G2 reviewers say costs climb quickly at higher event volumes.
Pendo
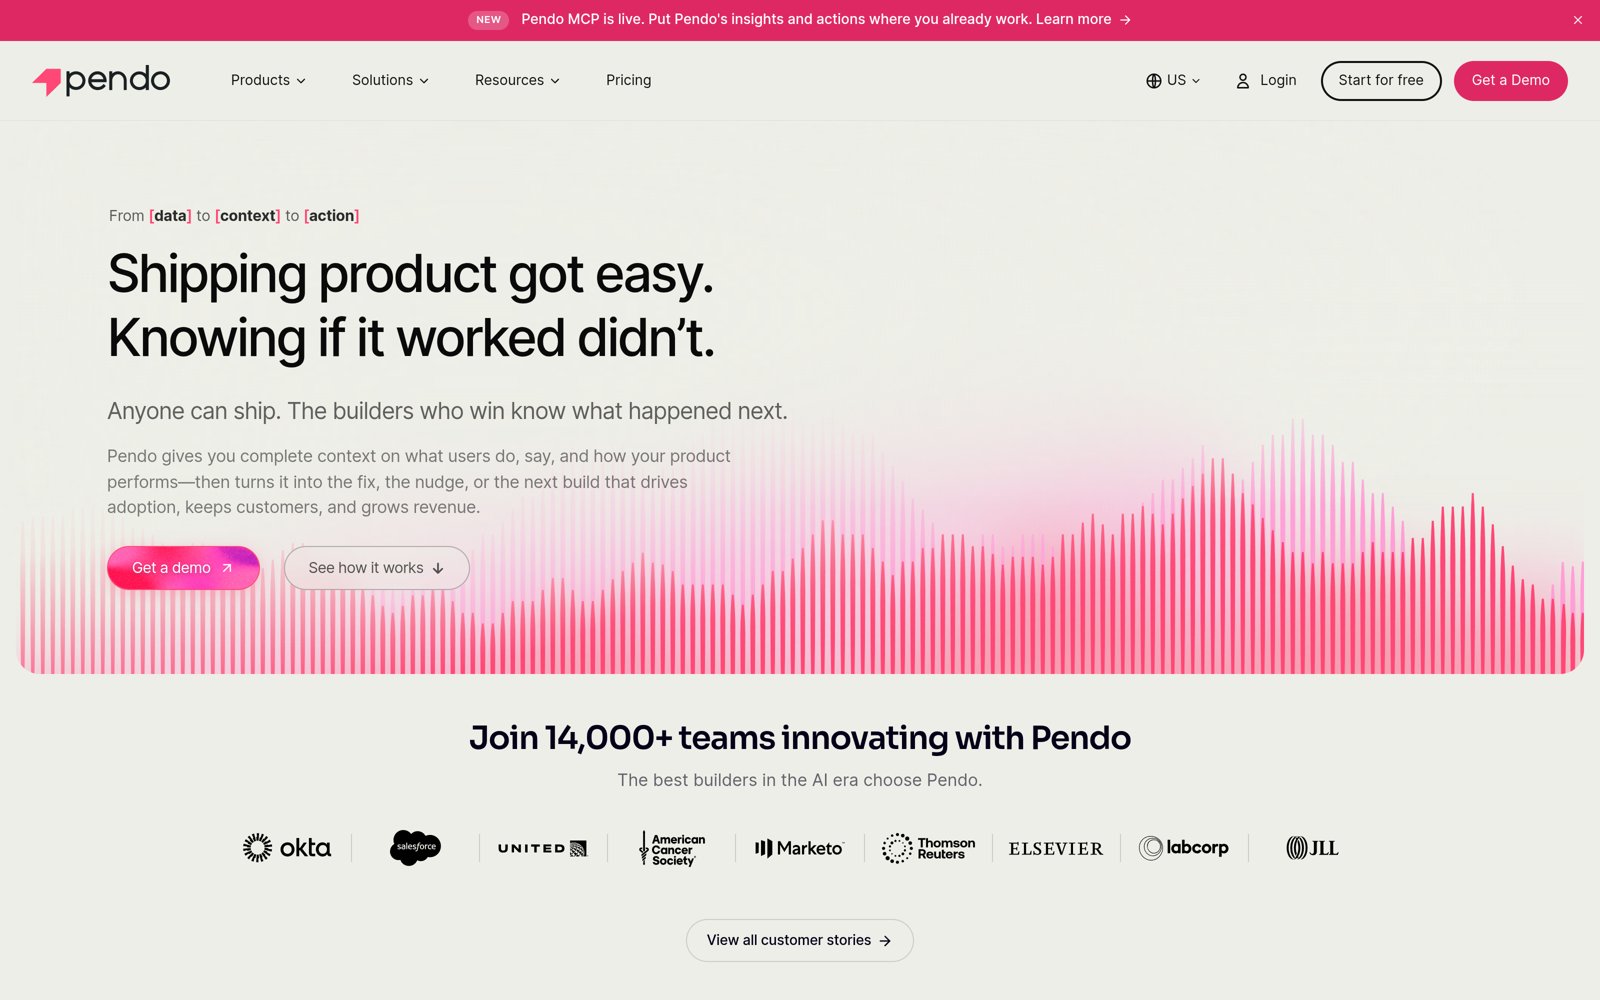
Best for: SaaS product, customer success and digital adoption teams that want analytics, in-app guides, session replay and feedback in one platform tied to account health.
- Pairs product analytics with in-app guides, so teams can act on adoption gaps without a separate onboarding tool.
- Pendo reports 14,000+ teams, 1 billion+ users and 40 trillion events tracked; G2 shows 4.4/5 from roughly 1,500+ reviews.
- Data Sync writes Pendo tables into Snowflake, Databricks or BigQuery, and a first-party MCP server answers questions in Claude.
- Hosts data in separate US, EU, Japan and Australia environments, with SOC 2 Type II and HIPAA support for regulated buyers.
Limitation: Paid plans are quote only, and G2 reviewers repeatedly flag cost that climbs with usage plus a learning curve from complex setup.
Fullstory
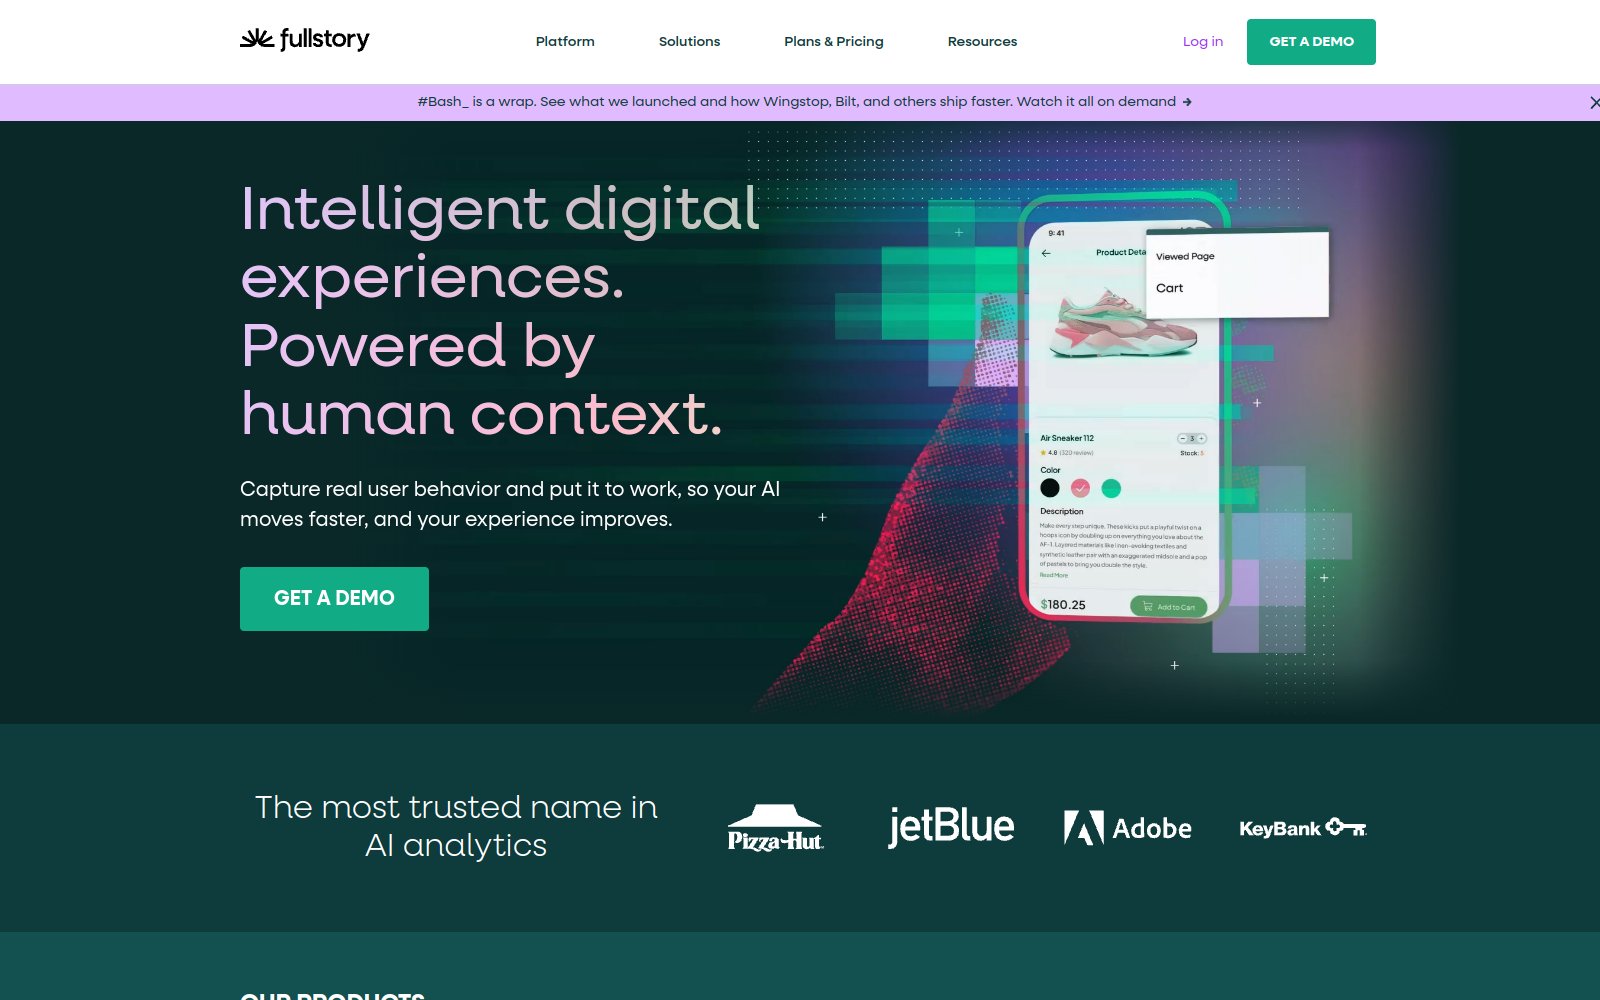
Best for: Product, UX and digital experience teams at mid-market and enterprise companies who want autocaptured behavioral data, session replay and AI-surfaced friction in one platform.
- Fullcapture autocaptures every click, scroll and input, so teams analyze past behavior without pre-planning event tracking.
- G2 shows 4.5/5 across 1,051 reviews, with reviewers praising support quality and its visual journey view.
- StoryAI agents flag friction and anomalies; Fullstory says StoryAI Summaries users act on insights 3.8x faster than non-AI users.
- Deep certification stack: SOC 2 Type II, ISO 27001, 27701, 27017, 27018 and ISO 42001 for AI, plus a private by default mode.
Limitation: Paid plans are quote only with no published prices, and warehouse export is a paid add-on rather than included, which makes cost at scale hard to estimate up front.
Quantum Metric
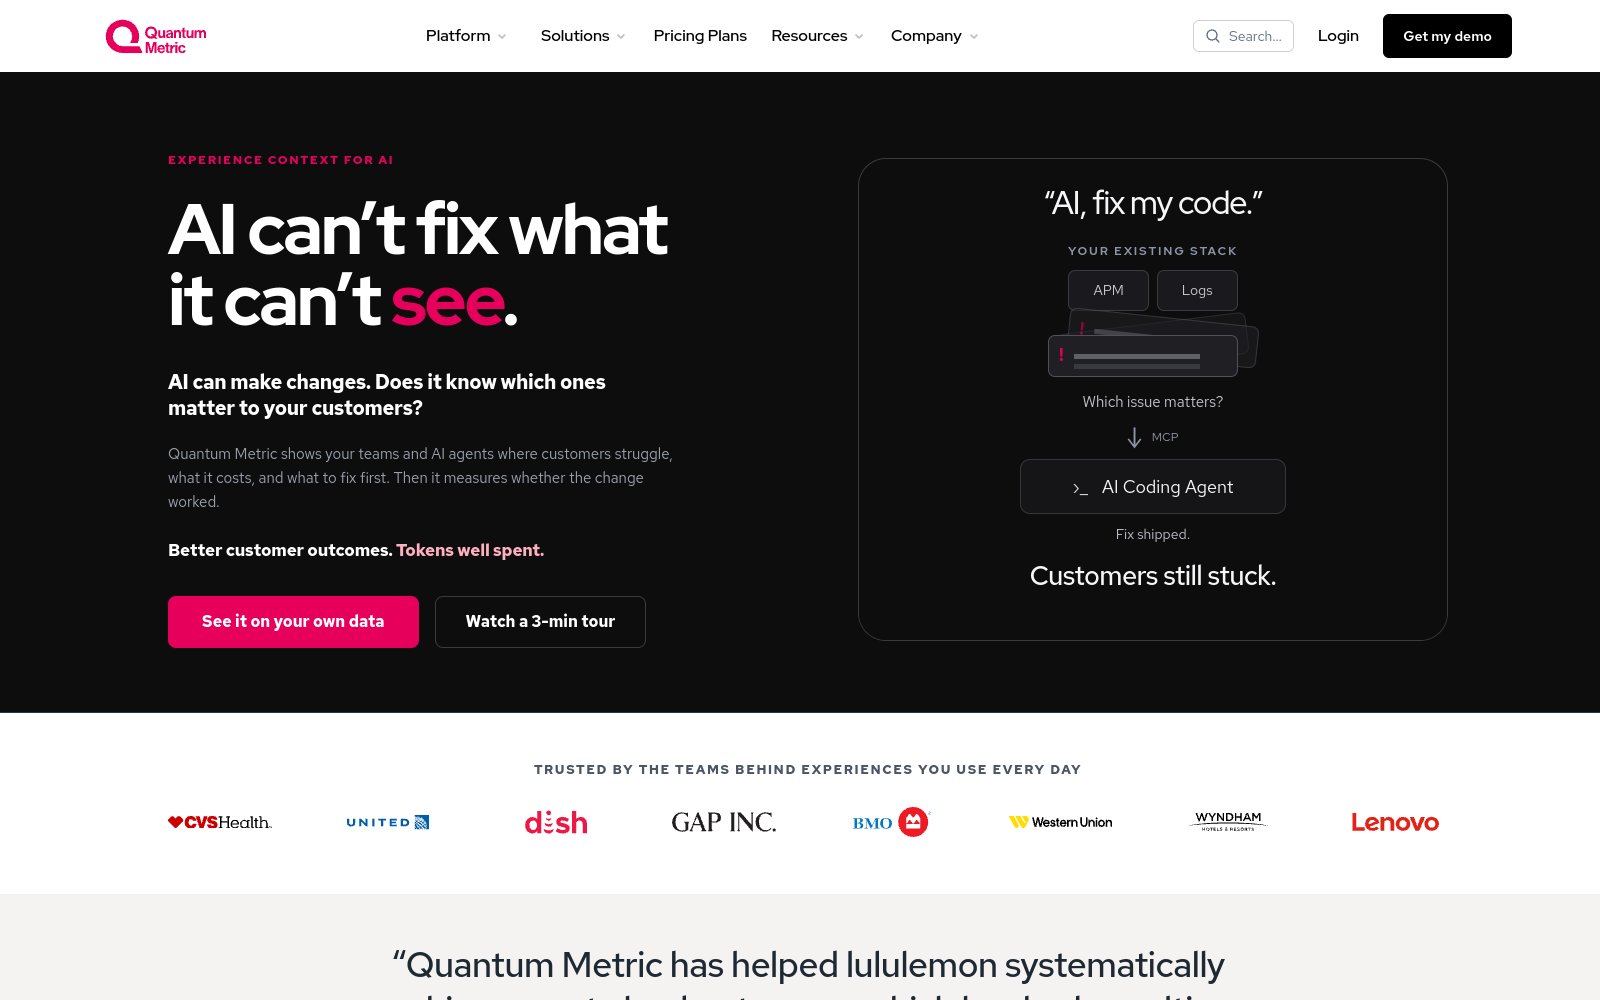
Best for: Enterprise digital, ecommerce and CX teams at large brands that need session replay, friction detection and revenue impact quantification across high traffic web and mobile apps.
- G2 rates it 4.6/5 across 276 verified reviews, with Gartner Peer Insights at 4.6/5 from 85 reviews (vendor site, Sept 2026).
- Autocapture records sessions without manual tagging and ships over 300 ready made metrics, cutting most instrumentation work.
- Felix AI agents group friction, quantify its revenue impact and summarize sessions; an MCP server feeds that data to AI tools.
- Holds SOC 2 plus HITRUST attestation and ISO/IEC 27001 certification, with per customer encryption keys and AutoPII masking.
Limitation: Pricing is custom and enterprise only with no free tier or published entry price, and G2 reviewers cite a steep learning curve and occasional session replay playback issues.
Heap
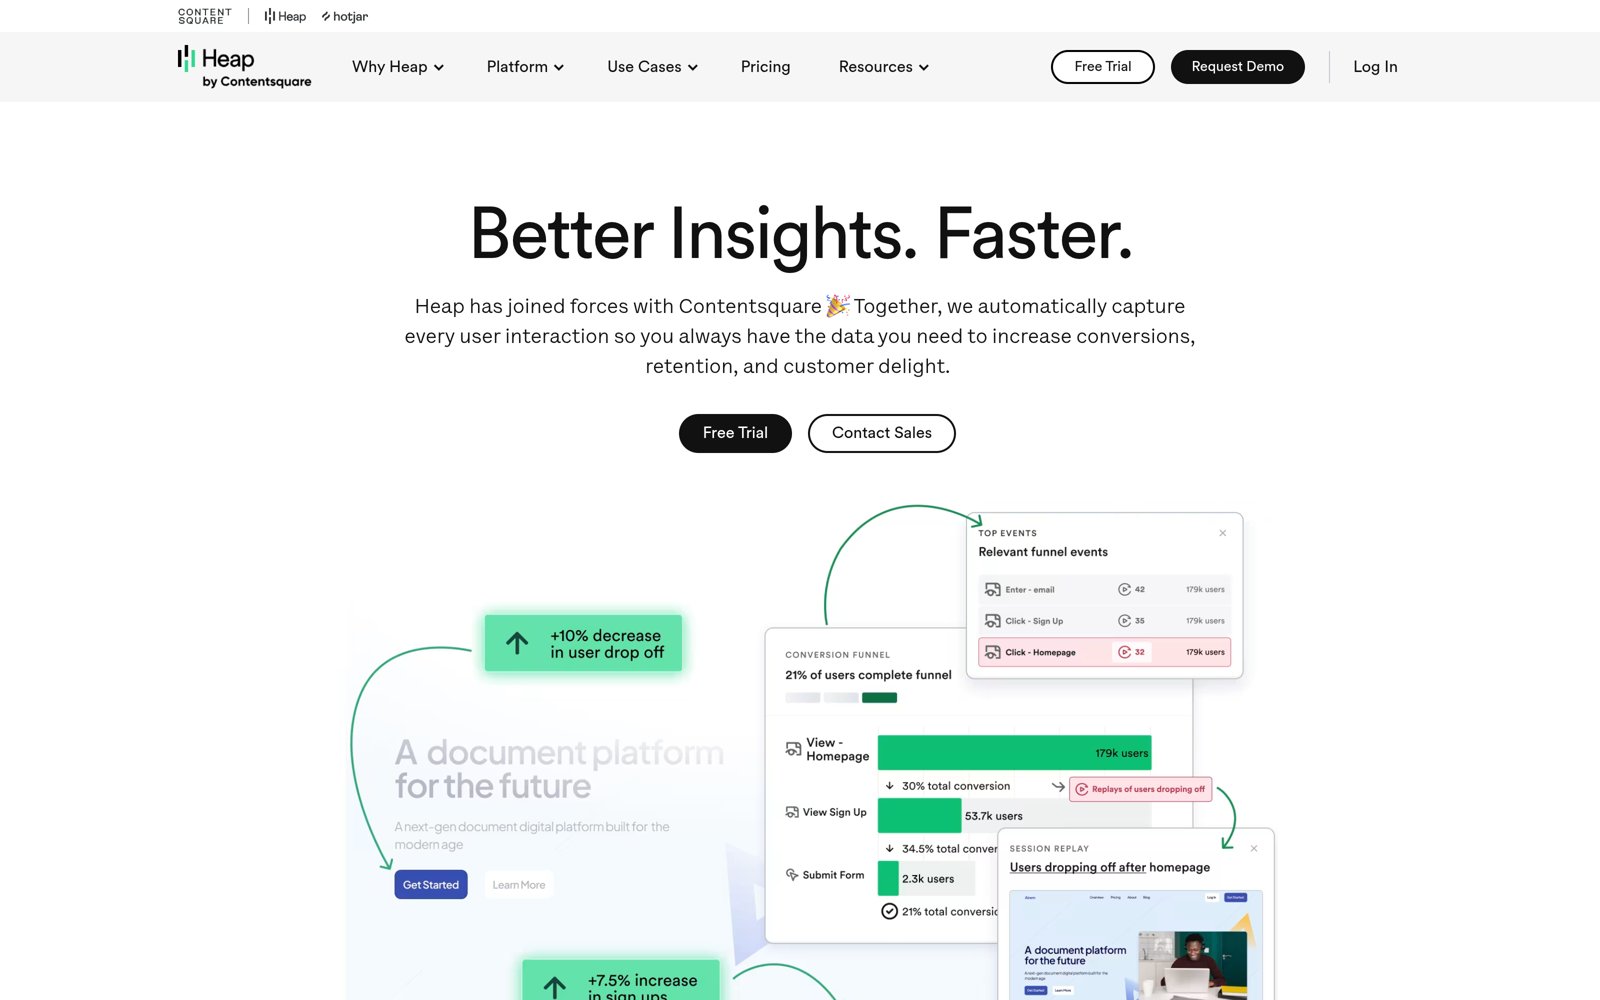
Best for: Product and growth teams that want every web and mobile interaction captured automatically, so they can answer funnel and journey questions retroactively without waiting on engineering.
- Autocapture records every click, pageview and form interaction, so events can be defined retroactively without new tracking code.
- G2 rates Heap by Contentsquare 4.4/5 across about 1,097 reviews, with Ease of Setup scored 8.5.
- Free plan covers up to 10,000 monthly sessions with core charts, six months of history, SSO and unlimited enrichment sources.
- Heap Connect syncs behavioral data to Snowflake, BigQuery, Redshift or S3, and Snowflake accounts can sync Heap segments back out.
Limitation: Paid tiers (Growth, Pro, Premier) publish no dollar prices, and the free plan excludes Session Replay and Heatmaps, while production data is hosted only in AWS us-east-1 per Heap’s Trust Center.
LogRocket
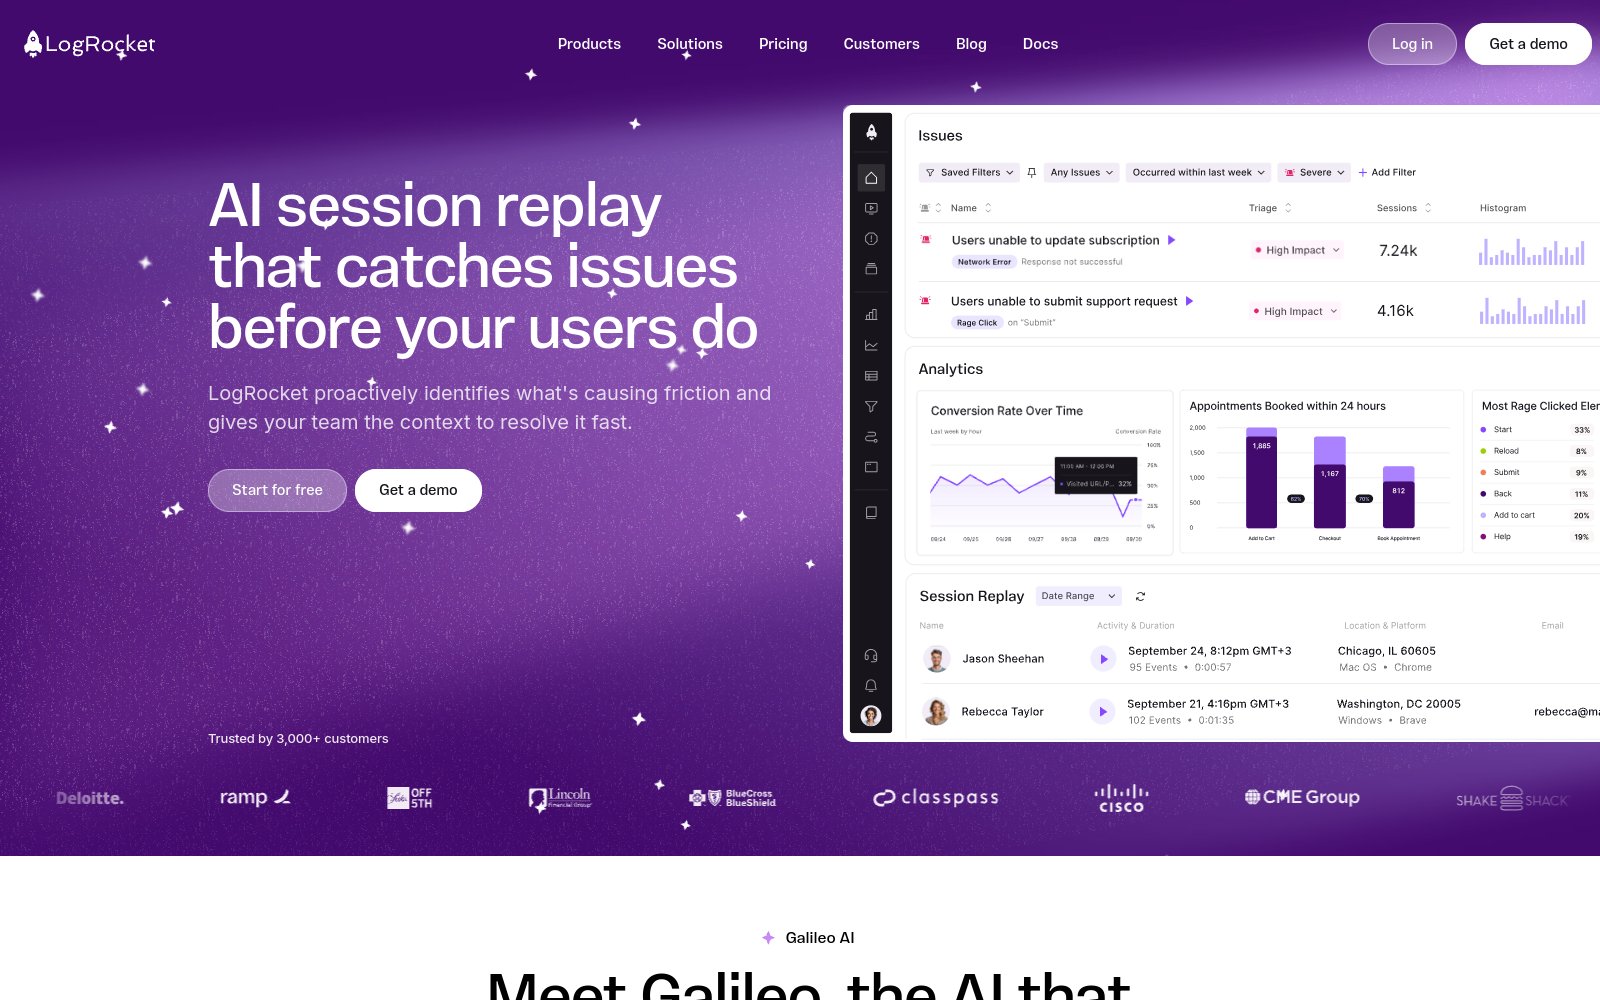
Best for: Product and engineering teams at digital businesses who want session replay, product analytics, and AI issue detection in one tool to fix friction that hurts conversion.
- Rated 4.6/5 on G2 across roughly 2,348 reviews, with 3,000+ customers claimed on its homepage.
- Galileo AI watches sessions, ranks issue severity, and supplies reproduction steps, cutting triage time for product teams.
- Pairs session replay with funnels, path analysis, and timeseries, so every metric drills straight down to real user sessions.
- Covers web plus native mobile via SDKs for iOS, Android, React Native, Flutter, Ionic, and Expo, with self-hosting on Enterprise.
Limitation: Galileo AI is locked to the Pro tier (from $292/mo for 10K sessions), and its analytics depth on retention and experimentation trails dedicated product analytics suites.
Userpilot
Best for: SaaS product and growth teams that want product analytics, in-app onboarding, surveys and session replay in one no-code platform without engineering help.
- Rated 4.6/5 on G2 across 988 reviews per Userpilot’s homepage; G2 pages show 4.6 with roughly 970 to 1,000 reviews.
- Combines funnels, paths, trends, cohorts and event autocapture with in-app flows, so teams can act on drop-offs directly.
- Session replay ties to funnel drop-offs with rage-click and error signals plus auto-masking; Growth includes 5k replays a month.
- Lists SOC 2 Type II, GDPR and HIPAA, with SSO, enforceable MFA and API data deletion; optional EU data hosting is offered.
Limitation: There is no free plan and entry pricing is $299 a month for only 2,000 MAU, while mobile, warehouse Data Sync and extra replays sit behind add-ons or Enterprise; G2 reviewers frequently cite a learning curve.
Kubit
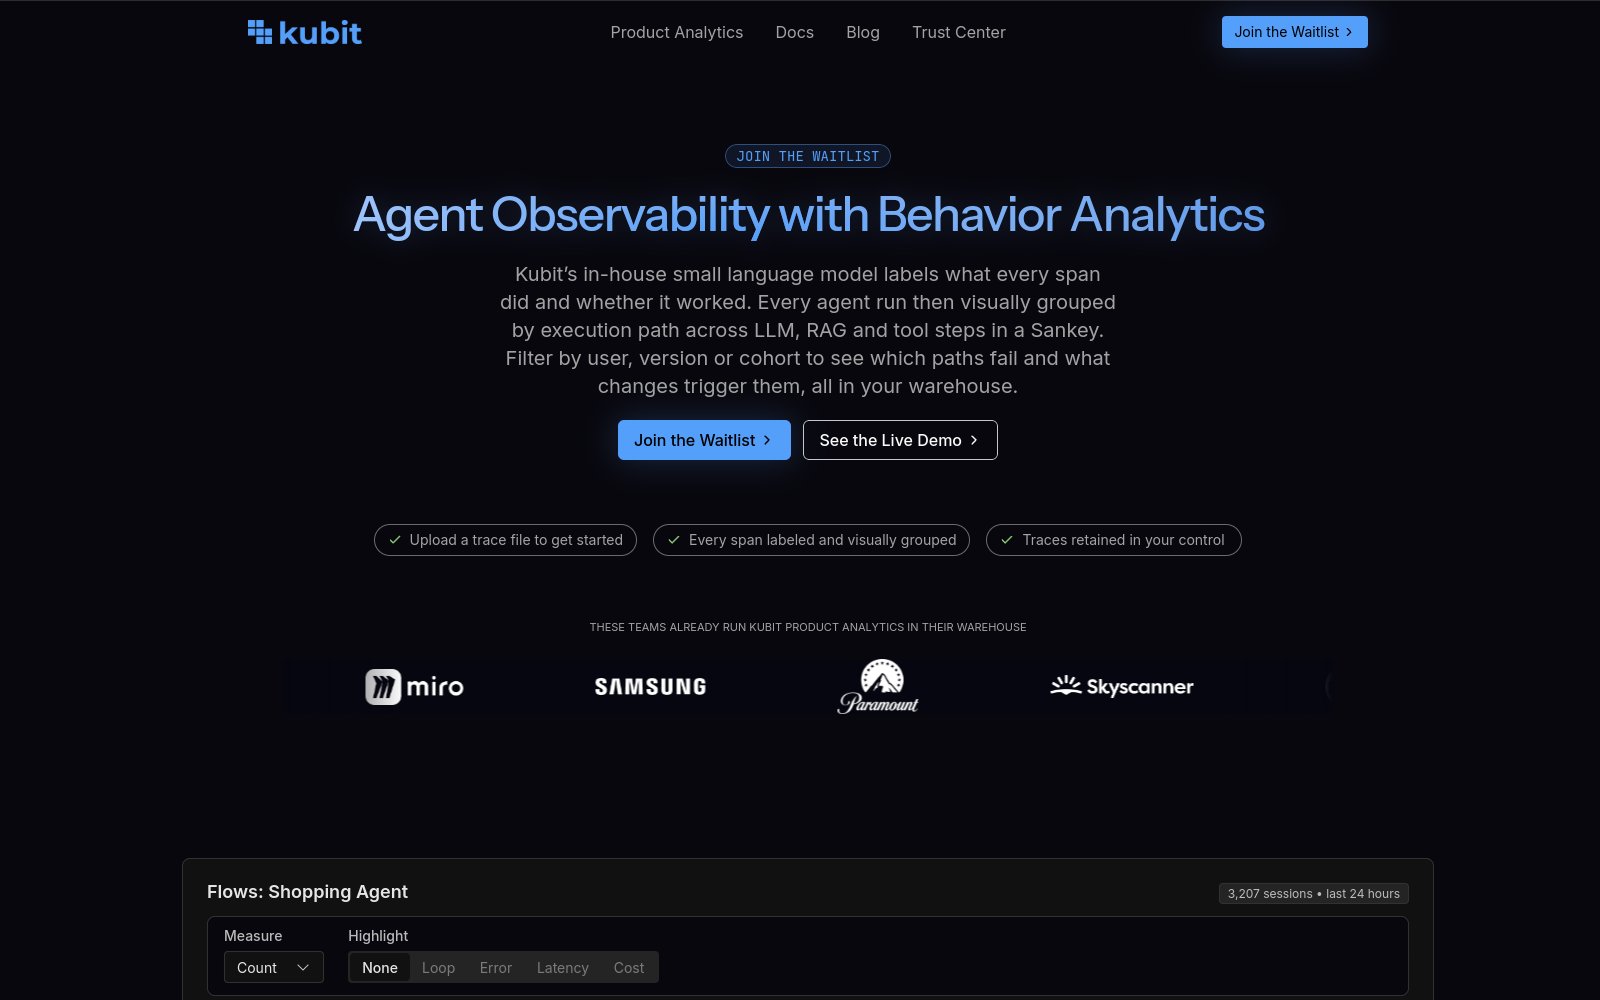
Best for: Data mature product and analytics teams that keep event data in Snowflake, Databricks, BigQuery or ClickHouse and want self serve analysis with zero data copies.
- Queries data in place inside Databricks, Snowflake, BigQuery or ClickHouse, so there is no second copy or data silo.
- G2 shows 4.5/5 across 31 reviews, with reviewers praising self service analysis on top of Snowflake.
- Funnels, retention, paths and cohorts can span both user behavior and AI agent traces collected through OpenTelemetry.
- MCP access feeds behavioral insights into coding agents like Claude Code; a Snowflake integration launched March 2026.
Limitation: Pricing is not published and new access runs through an early access waitlist, and the November 2026 pivot toward agent observability leaves classic web and mobile product analytics as a secondary message.
Side-by-Side Comparison
Summary of where each Product Analytics Tools tends to fit best.
| Platform | Best For | Key Strength | Primary Limitation | Score |
|---|---|---|---|---|
| Amplitude | Enterprise product analytics suites | Deepest all in one behavioral analytics plus experimentation stack among public vendors. | Pricing above the Plus tier is custom and quote based, and G2 reviewers repeatedly cite high cost at scale and a steep learning curve for event governance. | 91 |
| PostHog | Engineering led all in one teams | Broadest bundled toolset with transparent usage pricing and a large free tier. | Reviewers on G2 flag a crowded UI and confusing usability for nontechnical users, and the open source hobby self host is unsupported and sized for about 100k events per month. | 90 |
| Mixpanel | Self serve event analytics | Fast funnel, retention and cohort reports with a generous free tier. | A November 2025 smishing attack gave an intruder access to part of Mixpanel’s systems and led OpenAI to drop the vendor, and G2 reviewers say costs climb quickly at higher event volumes. | 87 |
| Pendo | SaaS adoption and in-app guidance | Analytics, guides, replay and NPS in one platform. | Paid plans are quote only, and G2 reviewers repeatedly flag cost that climbs with usage plus a learning curve from complex setup. | 86 |
| Fullstory | Autocaptured behavior and session replay | Retroactive analysis on autocaptured data, with AI that surfaces friction and revenue impact. | Paid plans are quote only with no published prices, and warehouse export is a paid add-on rather than included, which makes cost at scale hard to estimate up front. | 85 |
| Quantum Metric | Enterprise CX and ecommerce teams | Ties session replay and friction detection to quantified revenue impact. | Pricing is custom and enterprise only with no free tier or published entry price, and G2 reviewers cite a steep learning curve and occasional session replay playback issues. | 84 |
| Heap | Retroactive analysis without instrumentation | Autocapture plus Illuminate surfaces friction points teams did not think to track. | Paid tiers (Growth, Pro, Premier) publish no dollar prices, and the free plan excludes Session Replay and Heatmaps, while production data is hosted only in AWS us-east-1 per Heap’s Trust Center. | 83 |
| LogRocket | Replay led friction debugging | AI ranks user impacting issues across replay, errors, and funnels. | Galileo AI is locked to the Pro tier (from $292/mo for 10K sessions), and its analytics depth on retention and experimentation trails dedicated product analytics suites. | 82 |
| Userpilot | SaaS onboarding plus analytics | Analytics, guides, surveys and replay share one no-code platform. | There is no free plan and entry pricing is $299 a month for only 2,000 MAU, while mobile, warehouse Data Sync and extra replays sit behind add-ons or Enterprise; G2 reviewers frequently cite a learning curve. | 81 |
| Kubit | Warehouse first data teams | Zero copy analysis directly on your own cloud warehouse. | Pricing is not published and new access runs through an early access waitlist, and the November 2026 pivot toward agent observability leaves classic web and mobile product analytics as a secondary message. | 80 |
How Mktg.Tech Evaluated Each Product Analytics Tool
We used our 7-Point Evaluation Framework™, weighted for what matters most to Product & Growth Teams.
Scope & Breadth
Analytics Coverage – how many kinds of product question a team can answer in one place, judged on funnels, retention, cohorts, paths, session replay, experiments, feature flags and surveys across web, iOS, Android and server data.
Quality & Reliability
Data Accuracy & Governance – how far the numbers can be trusted, judged on autocapture versus planned instrumentation, schema and event governance, identity resolution, PII controls and data freshness.
Utility & Output
Insight Actionability – how quickly a product or growth team gets from a question to a decision and an action, judged on self serve reports, AI analysts, root cause tooling and the ability to act through guides, experiments or synced cohorts.
Communication & Integration
Stack & Warehouse Integration – how well the tool fits a modern data stack, judged on CDP and warehouse connectors, warehouse native or zero copy options, reverse ETL, APIs and MCP access for AI assistants.
Operational Excellence
Scale & Cost Efficiency – how the platform behaves as event volume and teams grow, judged on published pricing, free tiers, cost at high volume and the operational load of running it.
Trust & Versatility
Privacy & Compliance – whether regulated and global teams can adopt it, judged on SOC 2, ISO 27001, HIPAA, GDPR, data residency options, masking and self hosting.
Evidence & Impact
Proven Product Outcomes – evidence that the tool moves product metrics, judged on quantified case studies, review platform ratings and the size of the customer base.
How We Scored Each Product Analytics Tool
Data Sources Used
- Official Product & Pricing Pages: Analysis types, platform SDKs, plan names, free allowances and published unit prices read from each vendor’s own product, pricing and documentation pages, with quote only plans recorded as such.
- Product Release Notes: Dated 2025 and 2026 announcements and changelogs, used to confirm active development such as AI analysts, MCP servers, agent analytics and new warehouse connectors.
- Security & Trust Centers: SOC 2, ISO 27001, HIPAA and GDPR disclosures, data residency regions and PII masking controls taken from each vendor’s trust or security page.
- Independent Review Platforms: Ratings, review counts and recurring positive and negative themes from G2, Capterra, TrustRadius and Trustpilot, with blocked or snippet only figures labeled in the workbook.
- Customer Case Studies: Named customer results with quantified outcomes, labeled vendor published where they come from the vendor’s own site.
- Financial & Company Disclosures: Public filings, earnings releases, funding announcements and ownership changes, including acquisitions completed during 2025 and 2026.
Evaluation Filters
- Core Product Analytics: Must offer event based funnel, retention or path analysis on user behavior as a primary capability, not as a reporting add on.
- Multi Platform Data: Must collect or query behavioral data from web and at least one other source such as mobile apps, servers or a cloud data warehouse.
- Self Serve Analysis: Must let product and growth teams answer behavioral questions without writing SQL for every report.
- Active Development: Must show material product releases during 2025 or 2026, evidenced by dated release notes or announcements.
- Professional Focus: Must be sold to business product, growth or digital teams with documented security controls, not as a hobby or personal tool.
What’s Inside the Download
How the Framework Is Weighted
| Criteria | Weight | Relative Emphasis |
|---|---|---|
| Scope & Breadth | 20% | |
| Quality & Reliability | 15% | |
| Utility & Output | 15% | |
| Communication & Integration | 15% | |
| Operational Excellence | 15% | |
| Trust & Versatility | 10% | |
| Evidence & Impact | 10% |
Tool Background & Engagement Profile
| Platform | HQ / Parent Company | Typical Client Size | Primary Focus |
|---|---|---|---|
| Amplitude | San Francisco, CA (public, NASDAQ: AMPL) | Startups through Enterprise | Digital and product analytics platform |
| PostHog | San Francisco, CA (private, venture backed; YC W20) | Startups through Enterprise | All in one product analytics and dev tools |
| Mixpanel | San Francisco, CA (Mixpanel, Inc., privately held) | Startups through Enterprise | Event based product analytics |
| Pendo | Raleigh, NC (privately held; investors include Thoma Bravo) | Mid-Market through Enterprise | Product analytics with in-app adoption |
| Fullstory | Atlanta, GA (privately held, venture backed) | Mid-Market through Enterprise | Digital experience and behavioral analytics |
| Quantum Metric | Colorado Springs, CO (private, venture backed; Insight Partners led Series B) | Mid-Market through Enterprise | Digital experience analytics and replay |
| Heap | Paris, France (Heap is owned by Contentsquare, privately held; Heap originally founded in San Francisco, CA) | Startups through Enterprise | Autocaptured product and digital analytics |
| LogRocket | Boston, MA (private, venture backed) | Startups through Enterprise | Session replay plus product and UX analytics |
| Userpilot | Austin, TX (privately held) | SMB through Enterprise SaaS | Product growth: analytics plus in-app engagement |
| Kubit | Los Altos, CA (Kubit AI, Inc., privately held; HQ per Dealroom and CB Insights) | Mid-Market through Enterprise | Warehouse native product and agent analytics |
Key Capabilities Offered
Amplitude
- Behavioral analytics with funnels, retention, cohorts, journeys and path analysis across web, iOS, Android and server sources.
- Session replay and heatmaps tied to analytics charts, with 10,000 free replays a month.
- Feature Experimentation, Web Experimentation and unlimited feature flags, extended by the Statsig platform for agent and A/B experimentation.
- Guides and Surveys for in product messaging that acts on behavioral cohorts.
- Agent Analytics (GA August 2026) and Headless Amplitude with an MCP server and CLI for AI assistant and developer workflows.
- Warehouse import from Snowflake, BigQuery, Databricks and Redshift with CDC based data mutability, plus reverse ETL partners such as Hightouch and Census.
PostHog
- Product analytics with funnels, retention, paths, trends and SQL (HogQL) insights on autocaptured or custom events.
- Web and mobile session replay linked to analytics events and error tracking.
- Feature flags and A/B experiments run from the same event data as analytics.
- In app surveys priced per response after a 1,500 response monthly free allowance.
- Data warehouse that imports external sources such as Postgres, Stripe and HubSpot and supports saved, materialized views.
- Official MCP server and PostHog AI that let agents query data, manage views and explore the schema.
Mixpanel
- Funnels, retention, flows and cohort reports across product, web and mobile event data.
- Session Replay tied to analytics, with 10K replays per month on the free plan.
- Experiments and feature flags, with up to 10 active flags on the free plan.
- Warehouse Connectors that import data from Snowflake, BigQuery, Databricks, Redshift and Postgres.
- Mixpanel AI, a hosted MCP server and a Slack agent for natural language questions about data.
- Metric Trees that map how input metrics roll up to company level outcomes.
Pendo
- Product analytics with page, feature and track event data, funnels, paths and retention across web and mobile apps.
- In-app guides, walkthroughs and announcements that can target segments built from usage data.
- Session Replay included on Core and Ultimate plans for watching user sessions behind the metrics.
- Sentiment tools for NPS, PMF and CSAT surveys, plus Listen for feedback and Roadmaps for planning.
- Data Sync to Snowflake, Databricks and BigQuery, plus a Pendo MCP server for Claude, ChatGPT, Cursor and Copilot.
- AI layer including Pendo Predict for churn and health signals, Agent Analytics for AI agent usage, and the Novus beta agent.
Fullstory
- Session replay, heatmaps and product analytics across web and mobile apps, built on autocaptured interaction data.
- StoryAI agents, Ask StoryAI and StoryAI Opportunities, which surface drop-offs and estimate their revenue impact.
- Guides and Surveys for in-product tours, NPS and surveys, built from the 2025 Usetiful acquisition.
- Anywhere: Warehouse syncs data hourly to BigQuery, Snowflake and Redshift, with ready-to-analyze views for BI.
- Anywhere: Activation for real-time personalization and enrichment of the wider tech stack from behavioral signals.
- Fullstory MCP server with a prompt library that lets AI assistants query behavioral data.
Quantum Metric
- Session replay with Felix AI summarization and interaction heatmaps for web and native mobile apps.
- Autocapture of user interactions with a segment builder, journeys (path analysis) and dashboards.
- Opportunity analysis that detects friction points and quantifies revenue at risk, plus monitoring and real time alerts.
- Voice of Customer surveys and intercepts triggered by detected friction and linked to session data.
- Data streaming to Snowflake, BigQuery, Redshift, Databricks and Amazon S3, plus an MCP integration for AI tools.
- AI Agent Visibility that separates AI agent traffic from human sessions and flags abusive scraping.
Heap
- Automatic event capture across web and mobile apps, with APIs for server side and custom events.
- Charts, funnels, Journeys and segments for analyzing conversion paths and feature adoption by audience.
- Session Replay and Heatmaps tied to the same captured dataset (paid tiers).
- Heap Illuminate and Sense AI (Sense Chat) to surface hidden friction and answer questions in natural language.
- Heap Connect managed ETL into Snowflake, BigQuery, Redshift or S3, plus Snowflake segment syncing.
- Governance tools for event definitions and data management, with integration into Contentsquare’s broader experience analytics suite.
LogRocket
- Session replay with DOM playback plus console logs, network requests, errors, and performance data captured automatically.
- Product analytics with conversion funnels, path analysis, and timeseries, each linked to session replay drill downs.
- Galileo AI session summaries, issue detection, and funnel, heatmap, and feedback insights on the Pro and Enterprise tiers.
- Error tracking and frontend performance monitoring that prioritize network failures and crashes by user impact.
- Streaming Data Export add-on that pushes session events to Snowflake, BigQuery, Databricks, or S3.
- PII controls including a PII Labeling API, client side HTML rewrite rules, and log sanitization before data leaves the browser.
Userpilot
- Funnel, path, trend and cohort reports with event autocapture and custom dashboards.
- No-code onboarding flows, tooltips, banners, spotlights and an in-app Resource Center.
- NPS, CSAT and CES surveys delivered in-app, on mobile and by email, with feedback analytics.
- Session replay linked to funnel drop-offs, with rage-click and error signals and automatic masking.
- AI agent Lia, Agent Analytics, predictive analytics and an MCP server for AI assisted analysis.
- Native iOS and Android SDKs plus Data Sync export of raw events to Snowflake, BigQuery and Redshift.
Kubit
- Funnel, retention, path and cohort analysis run as queries against the customer’s own cloud data warehouse.
- Native connections to Snowflake, Databricks, BigQuery and ClickHouse with no data duplication.
- Ingestion of clickstream events from CDPs and agent spans through OpenTelemetry, including a bridge for Sentry and Embrace.
- Polaris, an in house small language model that labels every agent span for success, intent and sentiment.
- Flows and Triggers views that group agent runs by execution path and surface the deployed changes linked to failures.
- MCP access that pipes behavioral insights into coding agents such as Claude Code and Cursor.
Final Takeaway From Mktg.Tech
Across all evaluated sources and weighted performance criteria, Amplitude ranks as the strongest overall product analytics tool for 2026. It wins on the criteria that carry the most weight for product and growth teams: the broadest analytics coverage, spanning funnels, retention, session replay, feature experimentation, flags, guides and surveys on one event stream, strong governance and warehouse import, and the deepest evidence base, as a public company reporting $431 million in ARR and 855 customers above $100,000 a year in Q3 2026. PostHog runs it close on breadth with the most transparent usage pricing and free tier in the category, and Mixpanel remains the fastest route to self serve event analysis.
That does not make Amplitude the right choice for every team. Engineering led startups will often get more from PostHog’s bundled toolset and pricing, SaaS teams focused on in-app adoption may prefer Pendo or Userpilot, experience and ecommerce teams will lean toward Fullstory, Quantum Metric, Heap or LogRocket for replay led friction analysis, and data teams committed to their own warehouse should look hard at Kubit. The most important decision factor is how your behavioral data will be collected and owned, because that choice shapes accuracy, cost and every insight that follows.
Editorial Independence & About Mktg.Tech
About This Research
This report was independently produced by the Mktg.Tech Research & Insights team. Rankings are based on publicly available information, vendor product, pricing and security documentation, dated release notes, independent review-platform data, and structured evaluation against our 7-Point Evaluation Framework. No vendor included in this analysis paid for placement, ranking influence, or editorial consideration. Rankings will be reviewed and updated on a quarterly basis as product analytics continues to evolve.
Share Your 2026 Recognition
The companies featured in Mktg.Tech’s Best Product Analytics Tools of 2026 are invited to display this official badge on their website, documentation, or marketing materials. For transparency and verification, the badge should link back to the official report.
Use of this badge is intended for platforms included in the 2026 report and signifies verified inclusion.
Frequently Asked Questions
What are the best product analytics tools in 2026?
Amplitude ranks #1 in our 2026 evaluation with a score of 91 out of 100. It is best for product and growth teams at scaling and enterprise companies that want one platform for behavioral analytics, session replay, experimentation, feature flags and in-product guides.
How many product analytics tools did Mktg.Tech evaluate?
We evaluated and scored 10 product analytics tools for this ranking. Each one was assessed against the same 7-Point Evaluation Framework and scored out of 100, then ordered by final score.
How does Mktg.Tech score product analytics tools?
Every entrant is measured against seven weighted categories: Scope & Breadth (20%), Quality & Reliability (15%), Utility & Output (15%), Communication & Integration (15%), Operational Excellence (15%), Trust & Versatility (10%), and Evidence & Impact (10%). The weights total 100%, and the resulting score determines each platform’s rank.
Which product analytics tool is the best alternative to Amplitude?
PostHog ranks #2 with a score of 90 out of 100 and leads the Open Source Suite category, making it the strongest alternative for teams whose priorities differ from the overall winner.
Are these rankings sponsored or paid placements?
No. No vendor paid for placement, ranking influence, or editorial consideration. Rankings are based on publicly available information and structured evaluation, and are reviewed and refreshed on a quarterly basis.
How to Choose the Right Product Analytics Tools
Choosing a product analytics tool in 2026 is less about whether it can draw a funnel than about how the data gets in, how far it can be trusted and what a team can do once it has an answer. Every platform in this report covers funnels and retention. They differ sharply on autocapture versus planned tracking, warehouse fit, replay and experimentation depth, and what they cost once event volume grows.
The second thing to settle before a demo is who will use it. An engineering led team that wants flags, replay and SQL in one place, a product team that needs to act on adoption gaps inside the app, and a data team that keeps every event in the warehouse all run on behavioral data, but they reward different platforms, and a team that buys for the wrong user ends up with a tool nobody opens.
1. Decide How Data Will Get In
Every number downstream depends on the collection model, so settle it before comparing reports.
- Autocapture or Tracking Plan: Autocapture answers questions retroactively, while a governed tracking plan gives cleaner, named events. Many teams need both.
- Platform Coverage: Confirm SDKs for every surface you ship, including iOS, Android, React Native and server side events.
- Identity Resolution: Check how anonymous visitors merge with signed in users and accounts, especially for B2B products.
- Warehouse Native Option: If your events already live in Snowflake, BigQuery or Databricks, ask whether the tool can query them in place.
2. Match the Analysis to Your Questions
List the five questions your team asks most and test each vendor against them, not against a feature grid.
- Funnels and Retention: Verify conversion windows, holding constants and cohort comparisons work the way your team reasons.
- Session Replay: Check that every chart drills down to the sessions behind it, with masking on by default.
- Experiments and Flags: Decide whether experiments should share the analytics event stream or stay in a separate tool.
- AI Analysts: Test the AI assistant on your own data and confirm it shows the queries it ran, not just a summary.
3. Model the Real Cost at Scale
Product analytics pricing is driven by events, sessions or monthly tracked users, and the gap between a pilot and full rollout can be large.
- Pricing Unit: Know whether you pay per event, per session, per MTU or per seat, and estimate a year of growth.
- Free Tier Limits: Use free allowances for a real pilot, but check history limits and which features are excluded.
- Add Ons: Price warehouse export, replay volume, mobile and AI features separately, since several vendors sell them as add ons.
- Contract Terms: Ask about overage rates, multi year discounts and what happens when you exceed volume mid term.
4. Check Privacy, Security and Residency
Behavioral data often includes personal information, so the security review deserves real weight.
- Certifications: Request the SOC 2 Type II report and confirm ISO 27001 or HIPAA where your industry needs them.
- Data Residency: Confirm EU or other regional hosting if your users or contracts require it.
- Masking and Consent: Check default PII masking for replay and support for your consent management platform.
- Incident History: Ask vendors about past security incidents and what changed afterward.
5. Plan for Adoption, Not Just Purchase
The best analytics tool is the one product managers, designers and engineers open every week.
- Ownership: Name an owner for the tracking plan and event governance before rollout.
- Training: Budget time for onboarding, since reviewers repeatedly cite learning curves on advanced analysis.
- Workflow Fit: Push insights into the tools teams already use, such as Slack, the warehouse and AI assistants.
- Measured Outcomes: Agree on two or three product metrics the tool should improve and review them after one quarter.
Final Takeaway
The right product analytics tool should capture trustworthy behavioral data, turn it into decisions quickly and fit the stack and budget you will have next year, not just today. Prioritize platforms that offer:
- Reliable Collection: autocapture or governed tracking across every surface you ship.
- Fast Answers: self serve funnels, retention and AI analysts that show their work.
- Ways to Act: replay, experiments, guides or synced cohorts on the same data.
- Warehouse Fit: connectors or zero copy access to the data your team already owns.
- Predictable Cost: pricing you can model at three times today’s volume.
One pattern runs through this category and it is worth stating plainly: most conversion lifts, time savings and customer counts in product analytics are published by the vendors themselves, and the customer counts use different units, from paying accounts to free installs. Treat those figures as evidence of what is possible, pilot each shortlisted tool on your own event data, and judge every platform on the questions it answers for your team.